
The Seattle Times gets it right: prices are up
The Madison Park Blogger (however) gets it wrong
By Bryan Tagas
Soon after our last real estate posting hit the streets last month, The Seattle Times weighed in with a front-page article entitled “Double Digit Rise in King County Prices.” Using data from the Northwest Multiple Listing Service (MLS), the Times reported that the median price of single-family homes solid in the County rose 10.1% between June 2011 and June 2012.
In this month's edition of the Madison Park Times, however, I got the story wrong, as was pointed out to me today. Having misread the Times' map, I concluded that the Times had reported that Madison Park median prices were actually down. I incorrectly and unfairly took the Times to task for this error, when the error was in fact mine. I hate to have to admit that I got the story wrong, but I did.
Though Madison Park was not specifically cited in the Times' story, the accompanying map detailing the relative rise in home prices across the County showed our part of Seattle as being up a very sold 10-20%. Our area, Region 390, also includes Capitol Hill, Madrona and Leschi.

Area 380, the area just south of our part of town, was shown as having a decrease in values, ranking those Seattle neighborhoods right up there (or, rather, down there) with Renton, Fall City, and Black Diamond, three of the other six areas of the Puget Sound region with supposed price declines. That’s out of 35 Puget Sound geographic areas surveyed by the Times.
The Times gets its statistical information from the MLS, and a careful reading of the data shows that the mapmaker at the Times was correct in correlating the data to the map. I failed to read the map correctly and reported in the Madison Park Times that the Seattle Times had mis-stated the situation for Madison Park, reporting a decrease. Madison Park and the surrounding neighborhoods in MLS Area 390 are actually up 10.1% since June 2011, right in line with County’s overall increase.

Soon after the Times article was published, there was independent confirmation that when it comes to the median sales price our part of town is trending upward. Redfin, the independent real estate website, recently reported that the year over year increase for single-family homes sold in the 98112 zip code, which includes Madison Park and Capitol Hill, was a very solid 11.4% at the end of June.

As I always caution, looking at median sales prices is just a tool---and not a particularly good one. That’s because the houses that compose one period’s sales are not the same houses that are being sold in the period to which it’s being compared, making the whole analysis something much less than an apples-to-apples situation. Even so, as one real estate broker once noted when I was grousing about the problem: “Hey, median sales prices are the best we have. What would you suggest we use?” What indeed?
Leaving aside the issue of comparative median values, here’s a look at how the Madison Park market performed in the second quarter of 2012:
Houses
Sales: 21
Median Sale Price: $1,750,000
Average Sq. Ft.: 2,786
Average Price per Sq. Ft.: $385
Average Days on Market: 95
Average Discount from List Price: 5.2%
Condos
Sales: 11
Median Sale Price: $392,000
Average Sq. Ft.: 1,119
Average Price per Sq. Ft.: $350
Average Days on Market: 110
Average Discount from List Price: 9.9%
Selling activity was up dramatically over the level of the first quarter, in which only nine houses and condos were sold. It’s also an increase over the same quarter last year, in which 23 units were sold (versus 32 this year). This increased sales column is particularly noteworthy because of the decline in inventory over the last year. Recently, houses have been moving more quickly (an average 95 days on market in Quarter 2 versus 318 days, believe it or not, in Quarter 1 this year).
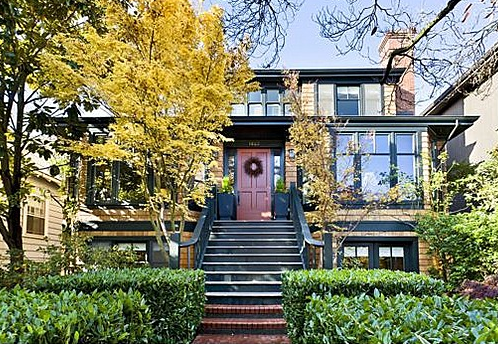
The most expensive house sold in the second quarter, for $1,825,000, was this late 20th Century four-bedroom Madison Park home with 4,194 sq. ft. of living space:
Of the 21 house sales, it’s remarkable that five actually sold for more than their original listing prices, one sale at $1,335,000 representing a 21.5% premium over the list price of $1,099,000. That sale occurred after the house was on the market only eight days. Also noteworthy was the homeowner who sold at original list price, $1,295,000, after the home had been 510 days on the market, proving that holding to your price sometimes actually works. On the other hand, one house sale occurred after it had been 236 days on the market, the owner taking a 23.1% discount from the initial asking price.
As noted, inventory is down from last year’s level. Here’s what’s currently available on the market in Madison Park (Broadmoor and Washington Park included) as reported by Redfin:
Houses
Listings: 55
Median List Price: $1,850,000
Median Sq. Ft.: 4,010
Median Price per Sq. Ft.: $461
Average Days on Market: 95
Percentage with Price Reductions: 31%
New Listings: 10
Pending Sales: 10
Condos
Listings: 18
Median List Price: $485,000
Median Sq. Ft.: 1,106
Median Price per Sq. Ft.: $439
Average Days on Market: 110
Percentage with Price Reductions: 39%
New Listings: 4
Pending Sales: 5
There were 81 homes available at this time last year, versus 73 now. True to form for this market, there are only eight houses for sale at under $1 million, while there are 21 houses available at over $2 million, the most expensive being a Broadmoor property at an “undisclosed” location, a Washington Park “Colonial Design” Estate, and a Washington Park spec mansion, each of the three listed at $6,950,000. The spec house boasts 8,900 sq. ft. of living space but is beat out by the Broadmoor manse, which has 10,095 sq. ft.. The Washington Park estate home has only 8,250 sq. ft. of living space, but it sits on more than a half acre of property.
At the other end of the spectrum: a 641-sq. ft. condo in Lakeview Lanai for $218,000.
[Thanks to Laura Halliday of Windermere Real Estate for her help in compiling the sales data. Listing data provided by Redfin, using information from the Northwest Multiple Listing Service. Photo of most expensive house sold courtesy of Redfin.]
No comments:
Post a Comment
Note: Only a member of this blog may post a comment.